OpenTelemetry Basics in Net6

If you’ve ever deployed a an application for performance testing, then I am sure you have run into situations when you needed to know more about the given metrics than provided by your cloud environment, by having internal application traces and metrics.
“What happened there?”
In this way, I came to OpenTelemetry. It’s an amazing testament to opensource awesomeness and I write this article as a fan, not a master.
the docs: https://opentelemetry.io/docs/instrumentation/net/
“OpenTelemetry for .NET is unique among OpenTelemetry implementations,” in that they made it super simple, even a humble developer like me can make it work.
mkdir OpenTelemetryWebApplication
cd OpenTelemetryWebApplication
dotnet new webapi
dotnet add package OpenTelemetry.Exporter.Console
dotnet add package OpenTelemetry.Extensions.Hosting
dotnet add package OpenTelemetry.Instrumentation.AspNetCore --prerelease
And done, deploy! I’m just kidding, we have lots of meticulous copy pasting to undertake.
First add a static class called “InstrumentationConfig” within our app.
public static class InstrumentationConfig
    {
        private const string serviceName = "MyExampleService";

        public static ActivitySource ActivitySource { get; set; } = new(ServiceName);

        public static string ServiceName => serviceName;
    }
This is for reusability, dependency injection, and just good organization.
Now let’s get the engine in the car. We need the program.cs to include the OpenTelemetry packages in order for traces to start being listened for and aggregated.
builder.Services.AddOpenTelemetry()
.WithTracing(tracerProviderBuilder =>
tracerProviderBuilder
.AddSource(InstrumentationConfig.ActivitySource.Name)
.ConfigureResource(resource => resource
.AddService(InstrumentationConfig.ServiceName))
.AddAspNetCoreInstrumentation()
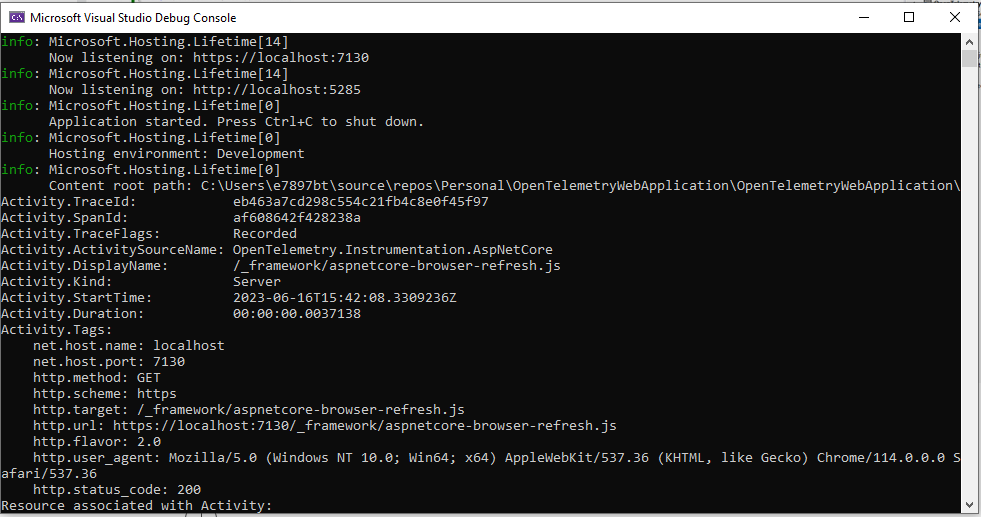
.AddConsoleExporter());After the initial setup for tracing, your program.cs and project structure should look something like this:

Heck yeah, turn the ignition, and crank her up! You’ll find you have more data than you’ll know what to do with, and these traces allow us, as developers to see how an application is running, and soon we will see how request move through each and everytime.
With OpenTelemetry tracing up and running we can customize exactly what we’d like to see within our traces. Let’s make changes in our WeatherForecastController and call up our static InstrumentationConfig for starting a activity named, “GettingWeatherForecasts.”
[HttpGet(Name = "GetWeatherForecast")]
        public IEnumerable<WeatherForecast> Get()
        {
            using var activity = InstrumentationConfig.ActivitySource.StartActivity("GettingWeatherForecasts");
            activity?.SetTag("foo", 1);
            activity?.SetTag("bar", "Hello, World!");
            activity?.SetTag("baz", new int[] { 1, 2, 3 });
            return Enumerable.Range(1, 5).Select(index => new WeatherForecast
            {
                Date = DateTime.Now.AddDays(index),
                TemperatureC = Random.Shared.Next(-20, 55),
                Summary = Summaries[Random.Shared.Next(Summaries.Length)]
            })
            .ToArray();
        }
Now, if we run the application and call the endpoint for pulling a few weather forecasts we will find our trace displays the activity by name and list the different tags we applied.

Oh wow, sky’s the limit now people. This means we can build as many custom static instrumentation classes per controller, and we can apply customized naming and tags within these events for tracing. The true power of all this comes later when we can visually see these records and patterns within Jaeger.
Now, that we have the basics of tracing down we can move on to metrics. That’s right folks, we can have all our internal metrics collected by this amazing opensource project.
Implementing metrics within our project is similar to how we implemented tracing. We will need to start by adding a few values to our InstrumentationConfig class. With metrics we will need to have a measurement, our measurement will need to be of a certain type. For this “Let’s Play,” we will use a Counter for counting the number of times the Get() method is called within the WeatherForecastController. To do so, we will add a meter to our InstrumentationConfig class.
public static class InstrumentationConfig
    {
        private const string serviceName = "MyExampleService";

        public static ActivitySource ActivitySource { get; set; } = new(ServiceName);

        public static string ServiceName => serviceName;

        public static Meter Meter { get; set; } = new(ServiceName);
        public static Counter<long> RequestCounter { get; set; } = Meter.CreateCounter<long>("app.request_counter");
    }
Since we added our meter inside our InstrumentationConfig, we will need to setup our OpenTelemetry service within our Program class.
builder.Services.AddOpenTelemetry()
    .WithTracing(tracerProviderBuilder =>
        tracerProviderBuilder
            .AddSource(InstrumentationConfig.ActivitySource.Name)
            .ConfigureResource(resource => resource
                .AddService(InstrumentationConfig.ServiceName))
            .AddAspNetCoreInstrumentation()
            .AddConsoleExporter())
    .WithMetrics(metricsProviderBuilder =>
        metricsProviderBuilder
            .ConfigureResource(resource => resource
                .AddService(InstrumentationConfig.ServiceName))
            .AddMeter(InstrumentationConfig.Meter.Name)
            .AddAspNetCoreInstrumentation()
            .AddConsoleExporter());
Next, we will will add our meter within our WeatherForecastController and add a few tags as well.
[HttpGet(Name = "GetWeatherForecast")]
public IEnumerable<WeatherForecast> Get()
{
using var activity = InstrumentationConfig.ActivitySource.StartActivity("GettingWeatherForecasts");
activity?.SetTag("foo", 1);
activity?.SetTag("bar", "Hello, World!");
activity?.SetTag("baz", new int[] { 1, 2, 3 });
InstrumentationConfig.RequestCounter.Add(1,
new("Action", nameof(Index)),
new("Controller", nameof(WeatherForecastController)));
return Enumerable.Range(1, 5).Select(index => new WeatherForecast
{
Date = DateTime.Now.AddDays(index),
TemperatureC = Random.Shared.Next(-20, 55),
Summary = Summaries[Random.Shared.Next(Summaries.Length)]
})
.ToArray();
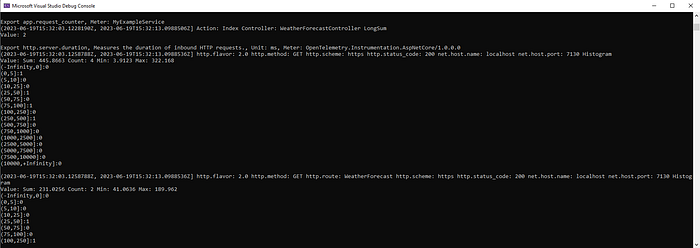
}Let’s startup the application and hit the endpoint for a few forecasts. We find we have our traces as before, but now we have some metrics coming in, a default histogram, and our custom meter named
Now figure out how to visualize everything we have accomplished with tracing and metrics, using nothing but bath salts and your third eye. Just kidding, OpenTelemetry has you covered.
The collector… oh sounds fancy, perhaps a little complex, or just a docker container running locally that you can point your code at and see everything looking beautiful. Yeah, life in 2023 is going good for us.
Here are 3 main reasons why Collectors are useful (according to OT)
- A single telemetry sink shared by multiple services, to reduce overhead of switching exporters
- Aggregate traces across multiple services, running on multiple hosts
- A central place to process traces prior to exporting them to a backend
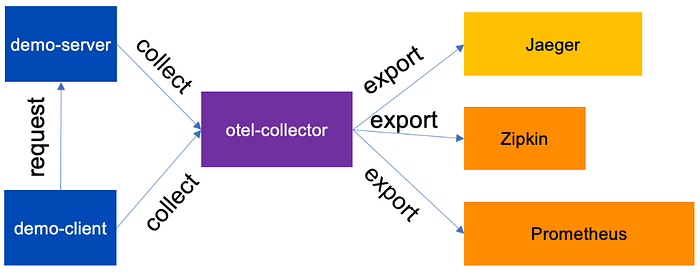
Here is brief overview using OT’s own diagram:
To configure and run a local collector we will need a few things. First, do you have docker desktop? If not, please go get it for your OS. Second, we will need to create a yaml file for the collector to be built by, and lastly we will need to add another package to our project, OpenTelemetry.Exporter.OpenTelemetryProtocol. I’ll be using VS Code to create my yaml file.
Straight up copy paste from the docs:
cd ..\.. #in C drive
mkdir tmp
cd tmp
code . # if you have this feature turned on for VS Code
Create the otel-collector-config.yaml:
# /tmp/otel-collector-config.yaml
receivers:
  otlp:
    protocols:
      http:
      grpc:
exporters:
  logging:
    loglevel: debug
processors:
  batch:
service:
  pipelines:
    traces:
      receivers: [otlp]
      exporters: [logging]
      processors: [batch]
    metrics:
      receivers: [otlp]
      exporters: [logging]
      processors: [batch]
With our config yaml in place, and Docker setup, we can run this command to turn on our local collector:
docker run -p 4317:4317 \
    -v /tmp/otel-collector-config.yaml:/etc/otel-collector-config.yaml \
    otel/opentelemetry-collector:latest \
    --config=/etc/otel-collector-config.yaml
This command run a image, otel/opentelemetry-collector, configured by creating a volume from our otel-collector-config, and its all exposed on port 4317.

If you find an error about the config file not being found, its because you’ll need to provide the absolute path pointing to the file.
Our last task is to add the nuget package, OpenTelemetry.Exporter.OpenTelemetryProtocol.
dotnet add package OpenTelemetry.Exporter.OpenTelemetryProtocolNow, with this package installed we can change our OpenTelemetry service within our Program class by removing AddConsoleExporter() and replacing it with AddOtlpExporter().
builder.Services.AddOpenTelemetry()
    .WithTracing(tracerProviderBuilder =>
        tracerProviderBuilder
            .AddSource(InstrumentationConfig.ActivitySource.Name)
            .ConfigureResource(resource => resource
                .AddService(InstrumentationConfig.ServiceName))
            .AddAspNetCoreInstrumentation()
            .AddOtlpExporter())
    .WithMetrics(metricsProviderBuilder =>
        metricsProviderBuilder
            .ConfigureResource(resource => resource
                .AddService(InstrumentationConfig.ServiceName))
            .AddMeter(InstrumentationConfig.Meter.Name)
            .AddAspNetCoreInstrumentation()
            .AddOtlpExporter());
And, congratulations, you are one “bad” developer now! nothing left to do but run it.
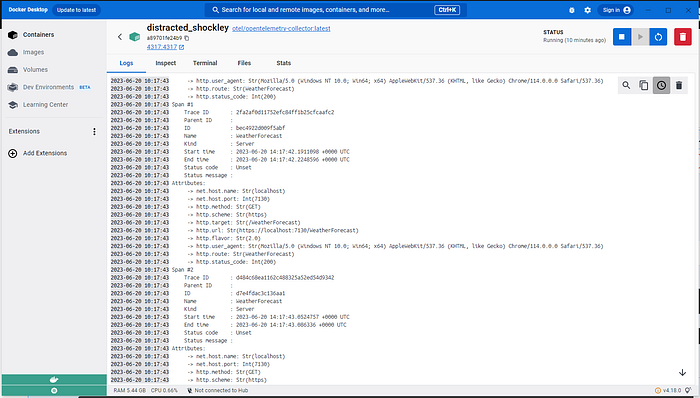
dotnet runNow, open the logs for you locally running otel-collector within docker and you should find the logs display all your traces and metrics.